Developing and Debugging JavaScript
Until a few years ago, debugging JavaScript in web sites was painful: write code in a text editor, add alert statements to inspect values, and iterate until things work.
The text editor is still the primary tool for JavaScript developers, but these days with syntax highlighting, code completion and other language specific tools. Depending on where developers come from, vi, UltraEdit, TextMate or GEdit are popular choices. There are also plugins for IDEs like Eclipse, or complete Eclipse distributions made for JavaScript development, like Aptana Studio.
With JavaScript now being at least equally important as HTML for creating web sites, all major browsers include a debugger or have one available as a plugin. For this workshop, we’ll be using the WebKit debugger, which is included in Google Chrome and Safari. For Firefox, the Firebug plugin provides similar functionality, and Internet Explorer >= 8 has its Developer Tools as well.
Getting Familiar with the Chrome Developer Tools
To launch the Developer Tools in Google Chrome, load the web page you want to debug (e.g. http://openlayers.org/dev/examples/example.html), and select Tools > Developer Tools from the wrench menu.
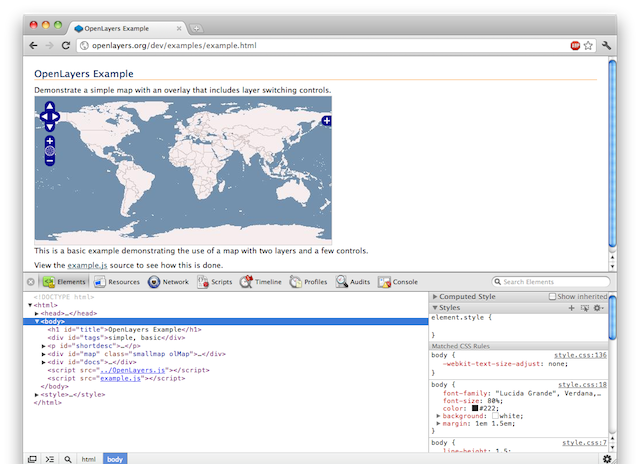
Chrome Developer Tools at the bottom of a browser window
The Developer Tools can also be detached from the browser window we’re debugging, by clicking the screen icon in the bottom left corner of the Developer Tools.
The first tab, Elements, is useful for inspecting the current state of the DOM and to see the applied styles from all stylesheet resources. Note that both the DOM and the styles can be modified in this tab, to see how they would affect the appearance of the page. Note, however, that these changes cannot be persisted to the source, so they are only temporary.
The second tab, Resources, gives an overview of all resources that the content of the browser window was created from - including browser databases, cache and cookies.
The Network tab is useful for investigating all traffic between browser and servers. Every request is listed, and has a detailed view showing request and response headers, query string parameters, and request and response data.
The Scripts tab is a feature rich JavaScript debugger, which we will cover in more detail later. It is accompanied by a JavaScript console, which can either be selected using the “Console” tab, or added to any other tab by clicking on the >≡ symbol.
Finally, there are three tabs for performance tuning and profiling (Timeline, Profiles and Audits), which we won’t be using in this workshop.
Working with the JavaScript Debugger
Using the Console
The console even makes sense when not debugging, e.g. just for trying out code snippets. It also supports copying and pasting. Line breaks can be added with Alt+Return. Most of the code snippets in the following sections can be tried out by pasting them into the console.
Selecting Files to Show in the Code Panel
On the top left, there is a dropdown with all JavaScript resources for the current web page. Let’s select OpenLayers.js from this dropdown. We can now see the contents of the OpenLayers.js file in the main panel of the debugger. If we scroll down, we see that the script is minified, so the lines are very long. This is inconvenient when we want to read the code or set breakpoints. But fortunately we can add meaningful line breaks and indents by clicking the {} icon at the bottom of the code panel.
Stopping JavaScript Execution on Errors
When running a web application and an error occurs, the Developer Tools list the number of errors with a red x in the bottom right corner. The console gives an rough explanation of each error. The Developer Tools have two settings for stopping execution, so the developer can do an inspection of the application state right before the error occurs. When clicking the Stop/Pause button in the bottom left of the JavaScript code panel once, execution will be stopped on any error. When clicking again, it will only stop on unhandled errors (i.e. those that don’t have a try/catch block around them).
Setting Breakpoints
In addition to the usual way of setting breakpoints by clicking on a line number in the code panel, the Chrome Developer tools support breakpoints for DOM manipulation (to be set in the Elements tab, with a right click on a DOM element), XHR requests (to be set by providing a URL substring) and browser events. All these kinds of breakpoints can be controlled with the panel right of the code panel in the Scripts tab.
JavaScript breakpoints can be conditional. To set a conditional breakpoint, right-click on the line number instead of just clicking on it.
Console Logging and Programmatic Breakpoints
To log values to the console, use console.log(). There are also other console statements that are useful for profiling, but console.log is the most important one.
To programmatically add a breakpoint, add the debugger keyword to your JavaScript code.
Online Tools for Developing JavaScript
When asking for help on Open Source project mailing lists, it can be useful to share code snippets. There are several tools available for this - http://gist.github.com/ is just one of many. But there are also tools that go beyond pasting code snippets, allowing to share small example applications. The most famous one is http://jsfiddle.net/.
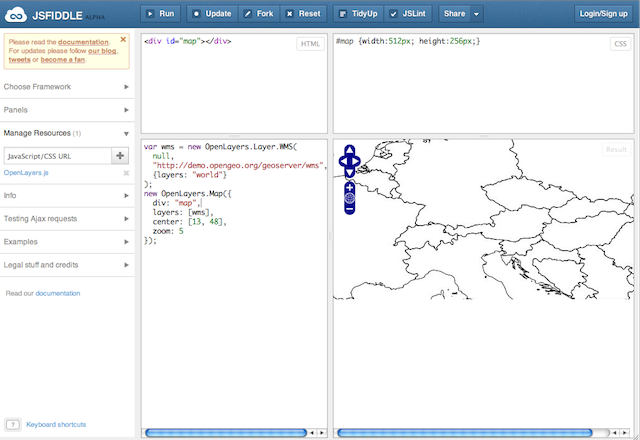
jsFiddle with extra editors for HTML, CSS and JavaScript
For even more web centric development and sharing full web applications on the web, Cloud9 (http://c9.io/) is a full web based JavaScript IDE.